Motor speed monitors and control system using GSM modem

              The purpose of  this project   is  to control   the speed and direction of  DC Motor  using Microcontroller and GSM Modem with password protection.    This uses a PWM  Pulse Width Modulation) technique to control the speed of motor from 0% to 100%. The   speed   of   the  motor   is  measured   using   contact-less   speed  measurement technique.  Speed control is done using PWM (Pulse Width Modulation) method.    User can  send SMS messages   to  control   the  motor   speed  and direction. A GSM modem attached to the control unit handles automatic SMS sending and receiving process.   As this monitoring and controlling can be done by any mobile phone, we provided a security feature by implementing password-based protection. User has to send the password along with the commands to be controlled.
           GSM Modem connected to microcontroller unit is used to control the motor and know the motor live speed. Microcontroller automatically reads the SMS messages stored in the SIM card and takes necessary action like speed control, direction control etc. There will be a particular code that needs to be sent through SMS to set the speed and get the speed from the DC motor  


Features of this project:
1. Remote monitoring and controlling of DC motor.
2. Can be operated from anywhere in the world.
3. Reliable for industrial and domestic needs.
4. Automatic remote speed measurement.


Hall Effect Sensor based non-contact tachometer for electrical motors speed measurement


Hall Effect Sensor based non-contact tachometer for electrical motors speed measurement


       The purpose of this project is to design and construct a non-contact type of Tachometer. A tachometer(also called a revolution-counter, rev-counter, or RPM gauge) is an instrument that measures the rotation speed of a shaft or disk, as in a motor or other machine. Hall Effect sensors typically use a rotating target attached to a wheel, gearbox or motor. This target may contain magnets, or it may be a toothed wheel. The teeth on the wheel vary the flux density of a magnet inside the sensor head.


        This project consists of a Hall effect sensor connected to a microcontroller unit. The sensor signals from Hall effect sensor are sent to microcontroller for rpm measurement. These measured final values arc displayed on a LCD display connected to microcontroller.


Engineering Project Topics and Project Ideas


Single Phasing Monitoring and Prevention System for 3-phase Industrial Loads


The aim of this project is to construct a single phasing monitor and prevention system using 8-bit microcontroller. Anti-single phasing relays or single phasing preventer are required for critical loads and circuits. These are required because the normal overload protection doesn't trip on time. For large air-conditioning compressors, irrigation pumps these are sometimes, included. 
      The purpose of this project is to develop an intelligent system that continuously monitors all the three phase voltages (High voltage AC) and if any of these three phases is disconnected then this system takes the preventive action. The preventive action could be disconnecting the power supply immediately to the load by operating an electromagnetic relay. This system also alerts the user using visual or audible indicators.

        This system consists of three optically isolated high voltage sensors for sensing the presence of high voltage in the respective circuits. One of the voltage sensors is connected to phase line of the supply and the other is connected to neutral line. A micro controller based control system continuously monitors the voltage in all the three phases of the power supply circuit. In ideal conditions all the three phases gets the same voltage. The visual indicators display the health status of all three phases (Red, Yellow and Green). But, when any of the phases gets disconnected then in such situations the micro controller-based system alerts the user about this in the form of visual or audible alerts.

Water Level Indicator, water level controller circuit

The Water Level Indicator employs a simple mechanism to detect and indicate the water level in an overhead tank or any other water container. The sensing is done by using a set of nine probes which are placed at nine different levels on the tank walls (with probe9 to probe1 placed in increasing order of height, common probe (i.e. a supply carrying probe) is placed at the base of the tank). The level 9 represents the “tank full” condition while level 1 represents the “tank empty” condition.
When the water-level is below the minimum detectable level (MDL), the seven segment displays is arranged to show the digit 1, indicating that the tank is empty, When the water reaches level1 (but is below level2) the connection between the probes gets completed (through the conducting medium – water) and the base voltage of transistor increases. This causes the base-emitter junction of transistor to get forward biased, this switches transistor from cut-off to conduction mode thus PIN (B0) of microcontroller is pulled to ground hence, the corresponding digit displayed by the seven segment display is 2. The similar mechanism applies to the detection of all the other levels. When the tank is full, all inputs to microcontroller become low and all its outputs go high. This causes the display shows a 9 also in this case a buzzer sound is given, thereby indicating a “tank full” condition.
Most water level indicators are equipped to indicate and detect only a single level. The Water Level Indicator implemented here can indicate up to nine such levels and the microcontroller displays the level number on a seven segment display. So, not only is the circuit capable of cautioning a person that the water tank has been filled up to a certain level, it also indicates that the water level has fallen below the minimum detectable level. This circuit is important in appliances such as the water cooler where there is a danger of motor-burnout when there is no water in the radiator used up also it can be used in fuel level indication.

Water Level Indicator Project Features:

  • Easy installation.
  • Low maintenance.
  • Compact elegant design.
  • The Automatic water level controller ensures no overflows or dry running of pump there by saves electricity and water.
  • Avoid seepage of roofs and walls due to overflowing tanks.
  • Fully automatic, saves man power.
  • Consume very little energy, ideal for continuous operation.
  • Automatic water level controller provides you the flexibility to decide for yourself the water levels for operations of pump set.
  • Shows clear indication of water levels in the overhead tank.

Hardware Description:

Water Level Indicator Project Block Diagram:

Water Level Indicator Block Diagram
Figure 2.1.1 Block diagram

Water Level Indicator Project Circuit Diagram:

Water Level Indicator Schematic Diagram

Water Level Indicator Project Description:

This is the circuit diagram and description for water level indicator.
  • A constant 5v power supply is given to the microcontroller and rest of the circuit from a battery.
  • The tank has 9 conductive type sensors (other types of sensors have been mentioned earlier but in our project only conductive type are used) embedded into it and 8 wires of sensors out of 9 are connected to transistors and the 9th is connected to 5v+ supply.
  • The use of transistor is it acts as inverter (i.e. in on state gives low voltage at output and in non conducting state gives high voltage at its output), all transistors outputs are connected to 1,2,3,4,5,6,7,8 pins (PORTB) of microcontroller.
  • Seven segment display is connected to pin no. 33 to 40 (PORTA). It is connected in common cathode fashion.
    The Output for the 7th level is not only shown in seven segment display but also indicated with a discontinuous buzzer sound.
  • Output for the 8th level (i.e. tank full condition) is not only shown in seven segment display but also indicated with a continuous buzzer sound.

Operation:

The operation of this project is very simple and can be understood easily. In our project “water level indicator” there are 3 main conditions:
  1. There is no water available in the source tank.
  2. Intermediate level i.e. either of 3rd to 7th level.
  3. There is ample amount of water available in the source tank.
So let us discuss on the more about these 3 conditions

CONDITION 1: Water not available

When the tank is empty there is no conductive path between any of the 8 indicating probes and the common probe (which is connected to 5v+ supply) so the transistor base emitter region will not have sufficient biasing voltage hence it remains in cut off region and the output across its collector will be Vc approximately 4.2v. As in this case the microcontroller is used in the active low region (which means it considers 0-2 volts for HIGH and 3-5 volts for LOW) now the output of transistor which is 4.2v approximately will be considered as LOW by the microcontroller and hence the default value given by microcontroller to the seven segment display is 1 which indicates as the tank is empty.

CONDITION 2: Intermediate levels

Now as the water starts filling in the tank a conductive path is established between the sensing probes and the common probe and the corresponding transistors get sufficient biasing at their base, they starts conducting and now the outputs will be Vce (i.e. 1.2v-1.8v) approximately which is given to microcontroller. Here the microcontroller is programmed as a priority encoder which detects the highest priority input and displays corresponding water level in the seven segment display. In this project while the water level reaches the 7th level i.e. last but one level along with display in seven segment a discontinuous buzzer is activated which warns user that tank is going to be full soon.

CONDITION 3: Water full

When the tank becomes full, the top level probe gets the conductive path through water and the corresponding transistor gets into conduction whose output given to microcontroller with this input microcontroller not only displays the level in seven segment display but also activates the continuous buzzer by which user can understand that tank is full and can switch off the motor and save water.

Flow Chart:

Water Level Indicator Flow ChartFigure 4.2.1 Flow chart
Flow chart gives the clear and easy understanding of the project. The process goes on as follows:
The microcontroller checks if the tank is full if the condition is satisfied it indicates the same on display unit and also sounds a buzzer if the condition fails it checks if the tank is filled upto level 7 and this process continues and the corresponding level is indicated in the display unit.

Conclusion and Scope:

Applications of Water Level Indicator:

  • Automatic Water level Controller can be used in Hotels, Factories, Homes Apartments, Commercial Complexes, Drainage, etc., It can be fixed for single phase motor, Single Phase Submersibles, Three Phase motors. (For 3Æ and Single Phase Submersible Starter is necessary) and open well, Bore well and Sump. We can control two motor and two sumps and two overhead tanks by single unit.
  • Automatic water level controller will automatically START the pump set as soon as the water level falls below the predetermined level (usually 1/2 tank) and shall SWITCH OFF the pump set as soon as tank is full.
  • Fuel level indicator in vehicles.
  • Liquid level indicator in the huge containers in the companies.
AUTOMATIC INTENSITY CONTROL OF INCANDACENT LAMP

CIRCUIT DIAGRAM
LINK:-https://www.dropbox.com/sh/h6facev3s0m4s2n/AAAKIZpmkATttzNi7ywwkgqza?dl=0

CODE
LINK:-https://www.dropbox.com/s/mw5dw002u8osmex/main.c?dl=0


Cell Phone Detector circuit

This is a mobile phone sniffer circuit that can detect the signals being used in the GSM (Global System for Mobile Communication) band at about 900 MHz. Since the signals are digitally encoded, it can detect only the signal activity, not the speech or the message contents. A headphone is used to hear the detected signals.

Project Description

The circuit schematic is given in the .rar archive attachment. There are two separate detector units. Every detector unit consists of a dipole antenna, a choke and a diode. The antenna receives the GSM signals in media. Then a small amount of charge is induced in the choke. The diode demodulates the signal and finishes detecting. The diodes must be schottky diodes or germanium diodes. Since the forward voltage of a silisium diode is high, it won’t give a sufficient result in this circuit. LM358 amplifies the received signal. It contains two separate op-amps that are supplied by a common power source. R3 and R7 resistors determine the gain of the amplifiers. When the resistor values are greater than 10M then the noise level increases. If they are small like about 100k, this time it becomes harder to hear the signal. 
The PCB file is provided in pdf format. You can apply it to the board by using the ironing method.
R1, R5 : 100K 1/4W Resistor
R2, R6 : 1k 1/4W Resistor
R3, R7 : 8.2M 1/4W Resistor
R4, R8 : 220 Ohm 1/4W Resistor
R9 : 2.2K 1/4W Resistor
D1, D2 : BAT43 Schottky Diode
C1, C2, C4 : 100nF Polyester Capacitor
C3 : 100uF 16V Electrolytic Capacitor
L1, L2 : See Text
U1 : LM358
J1 : 8 Pin Socket
J2 : Stereo JAck
1 × 9V Battery
1 × 9V Battery Socket
1 x LED
1 x On/Off Switch
Figure:1

Figure 1 

The diodes, gain of the amplifiers and the length of the antenna is critical in this circuit. Calculating the length of the antenna is simple. The formulation is given below.
λ=c/f = (300.000km/h)/900MHz =33.3 cm Then; Antenna Length = λ / 2 = 16.6 cm
So there are four pieces of antenna and each one is about 8.3 cm long. The wire type is not critical but its better to choose a fairly thick wire that will not bend too easily. It is a 1.5 mm diameter wire seen in the photo that we used. The two antennas must be positioned perpendicularly.
Figure:2

Figure 2 

The chokes are 10 turn molded chokes. The wire diameter should be about 0.5 – 06 mm and wound around a 5 mm cylindrical object.
Diodes are very critical. You should use one of BAT43, BAT45, AA112, AA116 or AA119. When a silisium diode is used the circuit also works but the detecting area becomes very very narrow.

Final Year engineering projects

IR based projects
1. Intelligent machine design by accessing the wireless commands.
2. Manchester code decoding controls the robot direction by Philips TV remoteTarget catching robotic arm manipulator (using IR communication
3. Wireless data communication through IR led and IR detector
4. Modern house automation (ac/dc) using IR communication.—
5. Pick and place robot.—
6. Autonomous robot with path tracer.—
7. Anti-theft alarm system.—
8. Automatic room light controller with visitor counter (IR sensor).—
9. Intelligent object counting system.—
10. Autonomous robot.—
11. Rc5 IR based remote device switching (IR remote).—
12. Channel IR based remote control.—
13. Home automation (ac/dc) using TV remote.—
14. Wireless vehicle path tracer using IR&RF.—
15. Robot arm manipulator.—
16. Blind stick robot.—
17. Automatic railway gate system.—
18. Token number display using IR.—
19. IR based distance measurement system.—

PC based projects
1. Home automation (ac/dc) using PC interface.—
2. PC based data acquisition system using (max232).—
3. Microcontroller enabled PC based industrial protection.—
4. Robot direction controlling using RF communication .remote monitoring any alarm on PC using radio communication.—
5. Miniature real-time controller (6-channel outputs) with PC interface and i2c protocol.—
6. GPS navigator/logger (microcontroller board +PC software)—
7. PC based dc motor speed control—
8. RF based communication system between keypad and PC—
9. 8 channel remote control using PC—
10. PC based smart home ---
11. PC based street light controller –
12. PC based temperature monitoring and control—
13. PC based remote controlled wireless automation system—
14. PC based ADC interfacing –
15. Industrial automation via PC .--
16. PC based data acquisition system by stimulating SPI and I2C protocol implementation.-
17. Microcontroller Based GSM and Pc interface.--
18.  PC based robot controlling.—
19. Robotic arm manipulator using PC.
20. RFID data logger using PC.—

RF communication projects

1. Modern house automation (ac/dc) using RF communication.—
2. Electronic eye with security system using RF with message broad casting.--
3. Advanced rail way signaling process by excluding manpower using RF.—
4. Incoming/outgoing vehicle alert from main gate. To control office using SMS transmitting through RF module.—
5. Robot direction controlling using RF module.--
6. SMS transmitting using RF modules.—
7. Wireless data acquisition system using RF.—
8. Industrial automation system using RF.—
9. Wireless data encryption and decryption using RF communication.—
10. Hi-tech wireless equipment controlling system.—
11. Home / office security system (safeguard) using RF.--
12. Railway gate control system using RF.—
13. Detecting the conditions of remote areas through data acquisition system using RF module.
14. Microcontroller based fire monitoring system in petrochemical industries using   RF communication—
15. Channel RF based remote control.—
16. Wireless digital code lock with a status display.—
17. Electrical apparatus control system in a plant using RF wireless communication.—
18. RF based remote controlled wireless automation system –
19. RF access system .—
20. RF Based multiple message sending—

Automatic Railway Gate Control & Track Switching

 
This project utilizes two powerful IR transmitters and two receivers; one pair of transmitter and receiver is fixed at up side (from where the train comes) at a level higher than a human being in exact alignment and similarly the other pair is fixed at down side of the train direction. Sensor activation time is so adjusted by calculating the time taken at a certain speed to cross at least one compartment of standard minimum size of the Indian railway. We have considered 5 seconds for this project. Sensors are fixed at 1km on both sides of the gate. We call the sensor along the train direction as ‘foreside sensor’ and the other as ‘aft side sensor’. When foreside receiver gets activated, the gate motor is turned on in one direction and the gate is closed and stays closed until the train crosses the gate and reaches aft side sensors. When aft side receiver gets activated motor turns in opposite direction and gate opens and motor stops. Buzzer will immediately sound at the fore side receiver activation and gate will close after 5 seconds, so giving time to drivers to clear gate area in order to avoid trapping between the gates and stop sound after the train has crossed.

The same principle is applied for track switching. Considering a situation wherein an express train and a local train are traveling in opposite directions on the same track; the express train is allowed to travel on the same track and the local train has to switch on to the other track. Two sensors are placed at the either sides of the junction where the track switches. If there’s a train approaching from the other side, then another sensor placed along that direction gets activated and will send an interrupt to the controller. The interrupt service routine switches the track. Indicator lights have been provided to avoid collisions. Here the switching operation is performed using a stepper motor. Assuming that within a certain delay, the train has passed the track is switched back to its original position, allowing the first train to pass without any interruption. This concept of track switching can be applied at 1km distance from the stations. 
Heart rate monitor using 8051
 
This article is about a simple heart rate monitor using 8051 microcontroller. Like the previous 8051 projects, AT89S51 is the microcontroller used here. The device senses the heart rate from the finger tip using IR reflection method and displays it on a three digit seven segment display in beats per minute. The circuit has an accuracy of 4 beats per minute and it is very easy to use. In medical terms, the technique used here for sensing heart rate is called photoplethysmography.

Photoplethysmography.

Photoplethysmography is the process of optically estimating the volumetric measurement of an organ. Pulse oximetry, cardiovascular monitoring, respiration detection, heart rate monitoring etc are few common applications of photoplethysmography. Let us have a look at the application of photoplethysmography in heart rate monitoring from the figer tip. When the heart expands (diastole) the volume of blood inside the finger tip increases and when the heart contrcats (systole) the volume of blood inside the finger tip decreases. The resultant pulsing of blood volume inside the finger tip is directly proportional to the heart rate and if you could some how count the number of pulses in one minute, that’s the heart rate in beats per minute (bpm). For this an IR transmitter /receiver pair is placed in close contact to the finger tip. When the heart beats, the volume of blood cells under the sensor increases and this reflects more IR waves to sensor and when there is no beat the intensity of the reflected beam decreases. The pulsating reflection is converted to a suitable current or voltage pulse by the sensor. The sensor output is processed by suitable electronic circuits to obtain a visible indication (digital display or graph).

Heart rate monitor using 8051.
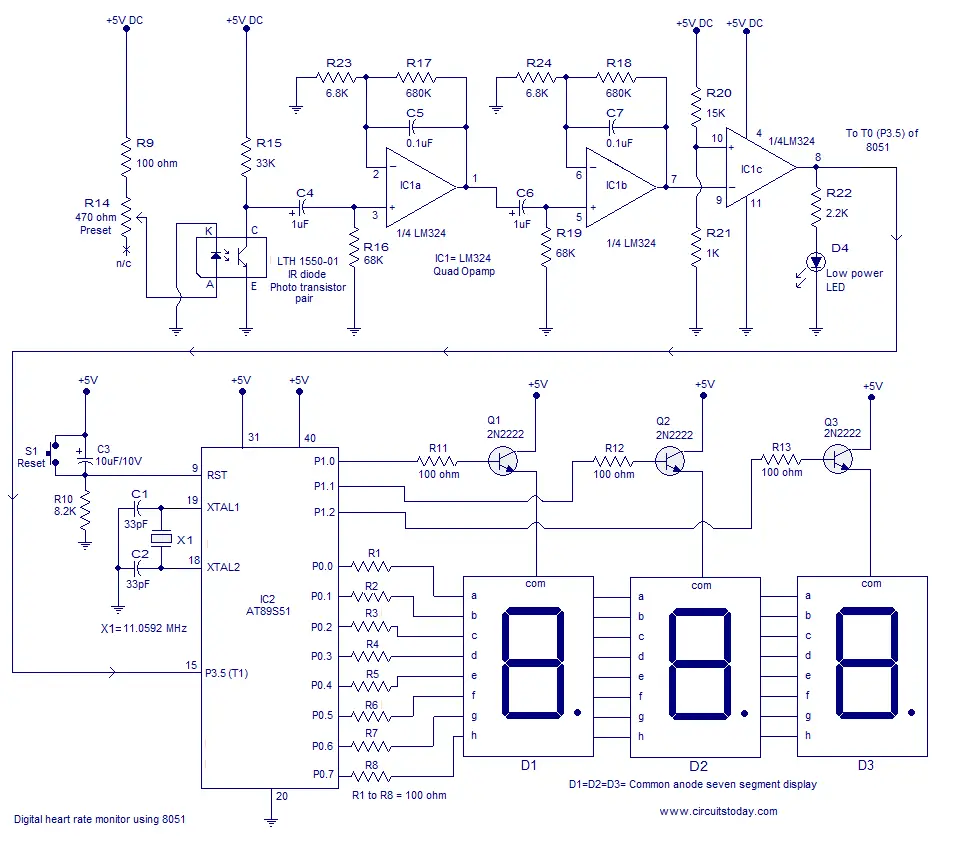
Circuit diagram.


Working of the heart rate monitor

LTH1550-01 photo interruptor forms the photoplethysmographic sensor here. LTH1550-01 is simply a IR diode – photo transistor pair in single package. The front side of the IR diode and photo transistor are exposed and the remaining parts are well isolated. When the finger tip is placed over the sensor the volumetric pulsing of  the blood volume inside the finger tip due to heart beat varies the intensity of the reflected beam and this variation in intensity is according to the heart beat.
When more light falls on the photo transistor it conducts more, its collector current increases and so its collector voltage decreases. When less light falls on the phototransistor it conducts less, its collector current decreases and so its collector voltage decreases. This variation in the collector voltage will be proportional to the heart rate. Any way this voltage variation is so feeble and additional signal conditioning stages are necessary to convert it into a microcontroller  recognizable form.
The next part of the circuit consists of a two active low pass filters using opampLM324.  The LM324 is a quad opamp that can be operated from a single rail supply. Resistor R23, R17 and capacitor C5 sets the gain and cut off frequency of the first filter. With the given component values, gain will be 101 and cut off frequency will be 2.5Hz. The gain and cut off frequency are determined using the following equations.
Voltage gain Av =1 + (R17 / R23)
Cut off frequency Fc= 1/(2π *R17*C5)
The second low pass filter also have the same parameters. The two low pass filters form a very critical part of the circuit as any noise or false signals passing to the microcontroller stage will produce disastrous results. The output of the filter stage will be a voltage level fluctuating between 0 and 0.35 volts and this fluctuation is converted into a 0 to 5V swing using the comparator  based on the third opamp (IC1c). The reference voltage of the comparator is set to 0.3V. When ever the output voltage of the filter stage goes above 0.3V, the output of the comparator goes to zero and whenever the output voltage of the filter stage goes below 0.3V, the output of the comparator goes to positive saturation. The result will be a neat pulse fluctuating between 0 and 5V at a rate equal to the heart rate. This pulse is fed to the microcontroller for counting.

Program.

ORG 000H // originMOV DPTR,#LUT // moves starting address of LUT to DPTRMOV P1,#00000000B // sets P1 as output portMOV P0,#00000000B // sets P0 as output portMAIN: MOV R6,#230D // loads register R6 with 230D SETB P3.5 // sets P3.5 as input port MOV TMOD,#01100001B // Sets Timer1 as Mode2 counter & Timer0 as Mode1 timerMOV TL1,#00000000B // loads TL1 with initial value MOV TH1,#00000000B // loads TH1 with initial value SETB TR1 // starts timer(counter) 1BACK: MOV TH0,#00000000B // loads initial value to TH0 MOV TL0,#00000000B // loads initial value to TL0 SETB TR0 // starts timer 0HERE: JNB TF0,HERE // checks for Timer 0 roll over CLR TR0 // stops Timer0 CLR TF0 // clears Timer Flag 0 DJNZ R6,BACK CLR TR1 // stops Timer(counter)1 CLR TF0 // clears Timer Flag 0 CLR TF1 // clears Timer Flag 1 ACALL DLOOP // Calls subroutine DLOOP for displaying the count SJMP MAIN // jumps back to the main loopDLOOP: MOV R5,#252DBACK1: MOV A,TL1 // loads the current count to the accumulator MOV B,#4D // loads register B with 4D MUL AB // Multiplies the TL1 count with 4 MOV B,#100D // loads register B with 100D DIV AB // isolates first digit of the count SETB P1.0 // display driver transistor Q1 ON ACALL DISPLAY // converts 1st digit to 7seg pattern MOV P0,A // puts the pattern to port 0 ACALL DELAY ACALL DELAY MOV A,B MOV B,#10D DIV AB // isolates the second digit of the count CLR P1.0 // display driver transistor Q1 OFF SETB P1.1 // display driver transistor Q2 ON ACALL DISPLAY // converts the 2nd digit to 7seg pattern MOV P0,A ACALL DELAY ACALL DELAY MOV A,B // moves the last digit of the count to accumulator CLR P1.1 // display driver transistor Q2 OFF SETB P1.2 // display driver transistor Q3 ON ACALL DISPLAY // converts 3rd digit to 7seg pattern MOV P0,A // puts the pattern to port 0 ACALL DELAY // calls 1ms delay ACALL DELAY CLR P1.2 DJNZ R5,BACK1 // repeats the subroutine DLOOP 100 times MOV P0,#11111111B RET DELAY: MOV R7,#250D // 1ms delay DEL1: DJNZ R7,DEL1 RET DISPLAY: MOVC A,@A+DPTR // gets 7seg digit drive pattern for current value in A CPL A RETLUT: DB 3FH // LUT starts here DB 06H DB 5BH DB 4FHDB 66H DB 6DH DB 7DH DB 07H DB 7FH DB 6FHEND

About the program.

For the counting purpose both the timers of 8051 (Timer0 and Timer1) are used. Timer 1 is configured as an 8 bit auto reload counter for registering the number of incoming zero going pulses and Timer0 is configured as a 16 bit timer which generate the necessary 1 second time span for the Timer1 to count.For counting the number of beats Timer0 and Timer1 are used. Timer1 is set as an 8 bit auto reload counter for counting the the number of pulses (indicating the heart beat) and Timer0 is set as a 16 bit timer which generates a 65536uS delay. When looped 230 times it will produce a 15 second time span (230 x 65536uS =15S)  for the Timer 1 to count. The number of counts obtained in 15 seconds is multiplied by 4 to obtain the heart rate in beats per minute.
 The Timer 0 which generates the 1 second time span is configured in Mode 1 (16 bit timer). So the maximum it can count is 2^16 and it is 65536. In 8051 the crystal frequency is divided by 12 using an internal frequency divider network before applying it as a clock for the timer. That means the timer will increment by one for every 1/12th of the crystal frequency. For an 8051 based system clocked by a 12MHz crystal, the time taken for one timer increment will be 1µS (ie; 1/12MHz). So the maximum time delay that can be obtained using one session of the timer will be 65536µS. Go through this article Delay using 8051 timer for a better grasp.
Setting up the circuit.
When power is switched ON, the indicator LED D4 will glow an continues in that state. Now place your finger tip over the sensor and adjust preset R14 so that the LED D4 starts blinking. After you got the LED blinking, reset the power and wait for 15 seconds. The display will show your heart rate in beats per minute.